A zero cash date is the exact date your business runs out of cash if current cash inflows and outflows continue as forecasted.
Most founders calculate runway using monthly averages. That approach is simple, but it often hides the timing of payroll, vendor payments, taxes, and customer collections.
The result is that a startup may appear to have six months of runway while actually running out of cash much sooner.
This matters because businesses fail when they run out of cash, not when they run out of runway on a spreadsheet.
In this guide, you will learn:
- what a zero cash date is and how it differs from runway
- how to calculate a cash out date startup teams can trust
- why weekly cash flow forecasting beats monthly averages
- a worked example where six months of runway becomes 4.5 months in reality
- how founders use weekly forecasts to avoid missing payroll
What Is a Zero Cash Date?
A zero cash date is the day your projected cash balance reaches zero.
It answers a simple question:
On what date will we run out of money if nothing changes?
Unlike runway, which is often expressed in months, a zero cash date gives a specific point in time.
Examples:
- September 12
- November 3
- January 18
This makes it easier to plan fundraising timelines, hiring decisions, vendor commitments, payroll obligations, and cost reductions.
What Is the Difference Between Runway and Zero Cash Date?
Runway estimates how long cash will last. Zero cash date identifies exactly when cash reaches zero.
Runway is typically calculated as:
Runway = Cash on Hand ÷ Monthly Net Burn
Example:
- Cash balance = $300,000
- Monthly burn = $50,000
- Runway = 6 months
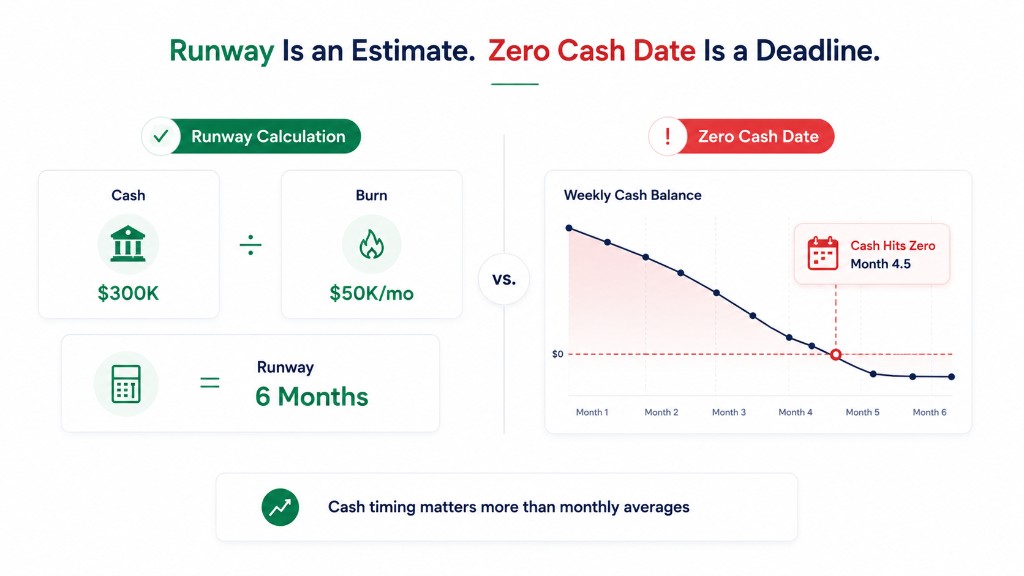
This formula assumes cash leaves the business evenly throughout each month. In reality, cash rarely behaves that way.
Most startups experience:
- payroll every two weeks or monthly
- large software renewals
- vendor invoices
- tax payments
- delayed customer collections
The timing of those events matters. That is why sophisticated finance teams track both runway and zero cash date. For the full vocabulary on burn rate and runway, see runway vs burn rate.
Why Can Runway Be Wrong?
Monthly runway calculations ignore cash timing.
A company can have six months of calculated runway and a much earlier cash out date because expenses and collections rarely occur evenly.
Imagine:
- payroll occurs on the 1st and 15th
- customers pay late
- annual software contracts renew unexpectedly
- a large vendor invoice arrives
The average monthly burn may remain unchanged. The actual cash position may not. This creates what finance teams call timing risk.
How Do You Calculate a Zero Cash Date?
A zero cash date is calculated by forecasting cash inflows and outflows over time until the projected balance reaches zero.
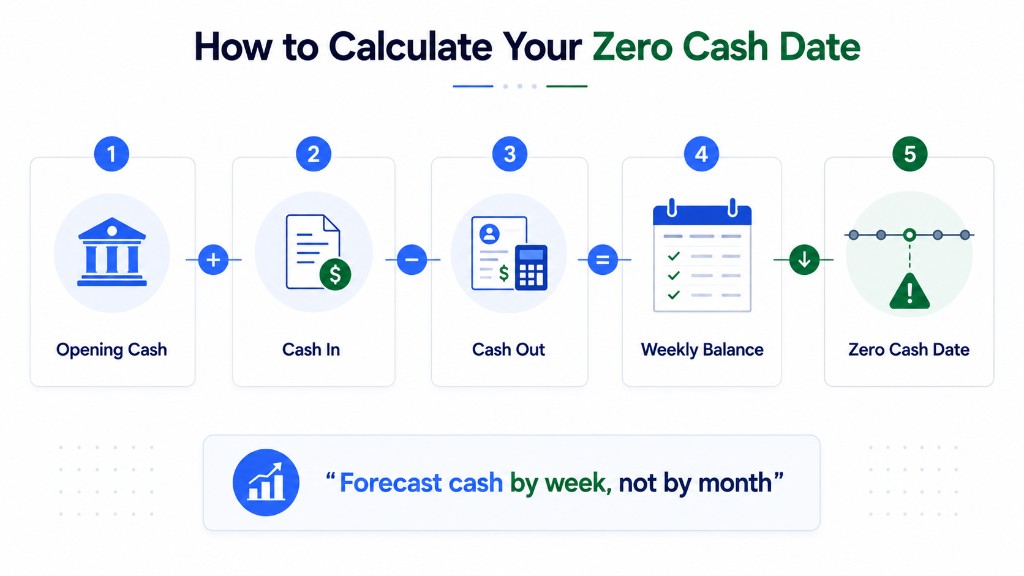
The process:
Step 1: Start With Current Cash
Example: current cash balance = $300,000
Step 2: Forecast Expected Cash Inflows
Examples:
- customer collections
- subscription revenue
- contract payments
- financing proceeds
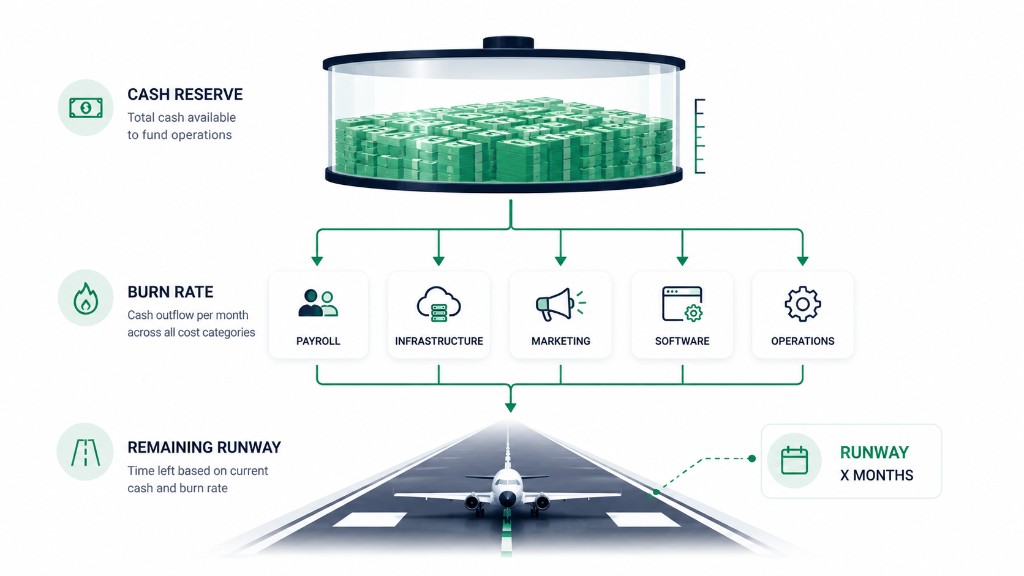
Step 3: Forecast Expected Cash Outflows
Examples:
- payroll
- rent
- software
- contractors
- taxes
- loan payments
Step 4: Forecast by Week
Instead of monthly averages, model each week separately. This is the core of how to calculate zero cash date accurately.
Step 5: Identify When Cash Reaches Zero
The week where projected cash becomes negative contains your zero cash date. That date becomes your operational deadline.
Why Should Startups Forecast Weekly Instead of Monthly?
Weekly forecasting captures cash timing. Monthly forecasting hides it.
Founders often ask how to calculate zero cash date accurately. The answer is almost always: use weekly cash flow forecasting, not monthly averages alone.
Weekly forecasting reveals:
- payroll concentration
- collection delays
- vendor payment spikes
- seasonal cash swings
Monthly averages smooth these events away. Unfortunately, your bank account does not operate on averages. For the broader framework, see what is cash flow forecasting.
Worked Example: 6 Months of Runway Becomes 4.5 Months
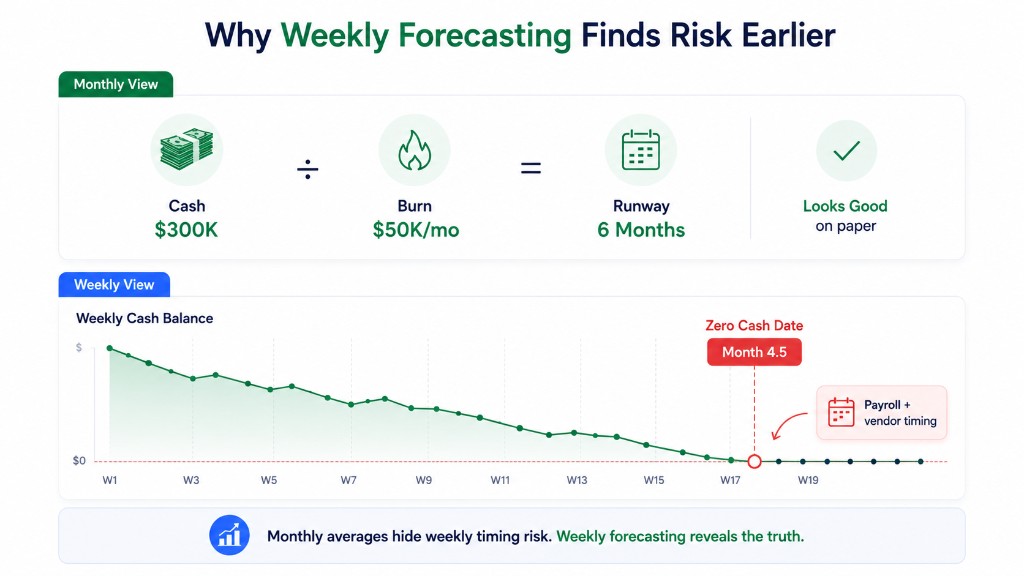
Monthly View
Starting assumptions:
- current cash: $300,000
- average monthly burn: $50,000
- runway: $300,000 ÷ $50,000 = 6 months
Everything appears fine. Many founders stop here.
Startup Profile
Cash timing in this example:
- payroll every two weeks
- vendor payments monthly
- software contracts monthly
- customer payments irregular and often delayed
Weekly Forecast
| Week | Opening Cash | Cash In | Cash Out | Ending Cash |
|---|---|---|---|---|
| 1 | $300,000 | $5,000 | $25,000 | $280,000 |
| 2 | $280,000 | $5,000 | $15,000 | $270,000 |
| 3 | $270,000 | $5,000 | $35,000 | $240,000 |
| 4 | $240,000 | $5,000 | $20,000 | $225,000 |
| 5 | $225,000 | $5,000 | $35,000 | $195,000 |
| 6 | $195,000 | $5,000 | $20,000 | $180,000 |
| 7 | $180,000 | $5,000 | $35,000 | $150,000 |
| 8 | $150,000 | $5,000 | $20,000 | $135,000 |
| 9 | $135,000 | $5,000 | $35,000 | $105,000 |
| 10 | $105,000 | $5,000 | $20,000 | $90,000 |
| 11 | $90,000 | $5,000 | $35,000 | $60,000 |
| 12 | $60,000 | $5,000 | $20,000 | $45,000 |
| 13 | $45,000 | $5,000 | $35,000 | $15,000 |
| 14 | $15,000 | $5,000 | $20,000 | $0 |
| 15 | $0 | $5,000 | $35,000 | -$30,000 |
What Happened?
The monthly average suggested 6 months of runway. The weekly forecast showed cash exhausted during month 4.5.
Same company. Same starting balance. Completely different outcome. The difference comes from timing. This is why zero cash date vs runway matters: one is a calendar deadline, the other is a smoothed average.
Why Does Weekly Cash Timing Matter So Much?
Most founders discover timing problems only after cash becomes tight.
Payroll Clustering
Many startups process payroll twice monthly. Cash outflows are concentrated rather than evenly distributed. Map pay-cycle risk with the payroll calendar calculator.
Delayed Customer Payments
Invoices are not cash. Customers often pay 15, 30, or 60 days late. Collections timing directly impacts your zero cash date. See ARR vs cash for why revenue and bank balance diverge.
Vendor Payment Spikes
Annual contracts often create sudden cash outflows: AWS commitments, software renewals, insurance, security tooling.
Tax Payments
Taxes rarely occur evenly throughout the year. Quarterly obligations can move a cash out date forward significantly.
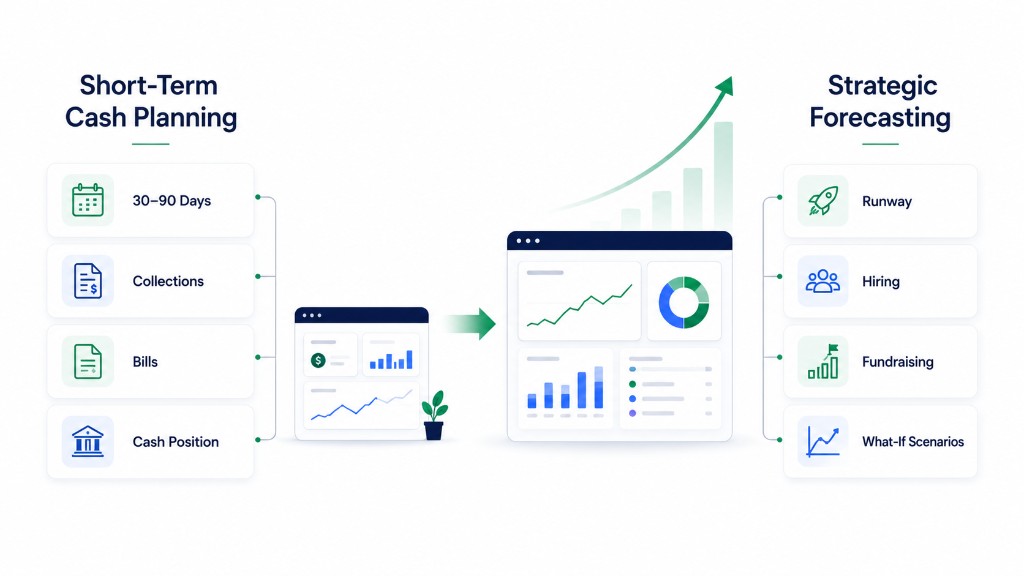
What Is the Best Forecasting Horizon for Zero Cash Date Planning?
Most startup finance teams use a rolling 13-week cash flow forecast.
A 13-week cash flow forecast tracks expected cash movement across the next thirteen weeks.
This approach is widely used because:
- weekly granularity captures timing risk
- thirteen weeks provides meaningful visibility
- forecasts remain manageable to update
If you are building a forecast today, start with a 13-week model. See our guide on what is a 13-week cash flow forecast.
How Can Founders Monitor Zero Cash Date Continuously?
A zero cash date is not static. It changes whenever revenue changes, expenses increase, collections slip, hiring plans shift, or fundraising timelines move.
This is why finance teams update forecasts frequently. Many founders begin with spreadsheets. As complexity increases, platforms like Zensus help teams model collections, payroll, runway, and cash flow scenarios in a single forecast while continuously updating the projected zero cash date.
At Zensus, founders connect bank data via Plaid, accounting via QuickBooks, and subscription revenue via HubSpot. The product calculates zero-cash date and runway from live balances, then lets you drill from monthly to weekly to daily cash flow, run scenarios in plain English, and get Slack alerts when a 30-day projection crosses a cash floor you set.
The goal is not forecasting perfection. The goal is avoiding surprises.
What Tools Can Help Calculate a Zero Cash Date?
Runway Calculator
The simplest starting point is the free startup runway calculator. While runway is not the same as a zero cash date, it provides a useful first estimate and a projected zero-cash calendar date.
13-Week Forecast
For more accurate planning, build a rolling weekly model. Start with our guide on 13-week cash flow forecasting or download the free XLSX template.
Payroll Risk Analysis
If your biggest concern is payroll, see will I make payroll and what happens if you miss payroll.
What Should Founders Do If Their Zero Cash Date Is Too Close?
If your forecast shows a cash out date startup leaders should worry about, focus on actions that change timing.
Examples:
Accelerate Collections
- follow up on overdue invoices
- offer annual prepayment discounts
- improve billing processes
Delay Non-Essential Spending
- postpone discretionary purchases
- delay software upgrades
- renegotiate vendor terms
Reevaluate Hiring Plans
Hiring is often the largest controllable expense. Model impact with scenario planning before you commit.
Start Fundraising Earlier
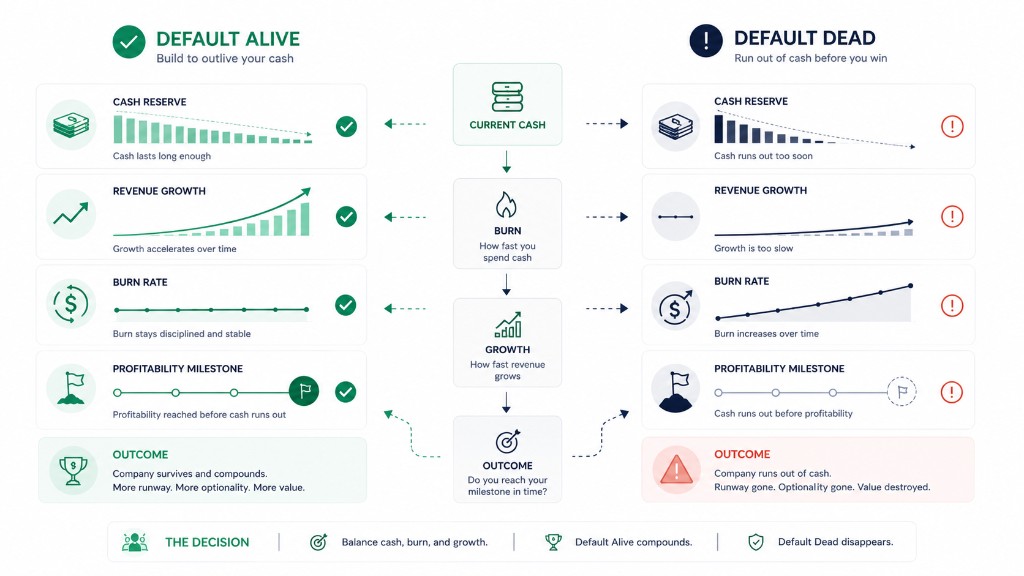
Most fundraising processes take longer than expected. If your forecast says six months, act as if you have four. See default alive vs default dead for investor framing.
Final Thoughts
A runway number is useful. A zero cash date is actionable.
The difference matters because businesses do not fail when a runway formula reaches zero. They fail when the bank account does.
That is why founders should forecast cash weekly, not just monthly. A weekly forecast reveals timing risks, collection delays, payroll pressure, and upcoming cash shortages long before they become emergencies.
Whether you use a spreadsheet, a 13-week forecast, a runway calculator, or a platform like Zensus, the objective is the same: know your zero cash date before it becomes a surprise.
Plans are on the pricing page.