A sales pipeline is not cash.
A deal marked Commit in HubSpot may not generate cash for 30, 60, or even 90 days. Close dates, contract start dates, billing structures, payment terms, and customer payment behavior all affect when money actually reaches your bank account.
This is why founders often see a healthy pipeline but still struggle with cash flow.
Understanding how to convert pipeline into cash is one of the most valuable pipeline cash flow forecasting skills a startup can develop.
In this guide, you will learn:
- how HubSpot cash flow forecasting differs from pipeline reports
- how to convert pipeline to cash forecast with probability and timing
- why billing terms and payment behavior change sales pipeline to cash outcomes
- why a $100,000 Commit deal can produce zero cash for 75 days
- how to connect CRM pipeline data to runway and bank balance
What Is a Pipeline Cash Flow Forecast?
A pipeline cash flow forecast estimates when sales opportunities will turn into actual cash deposits.
Most CRM forecasts answer:
How much revenue are we likely to close?
A cash flow forecast answers:
When will cash arrive in the bank?
Those are different questions. For founders managing payroll, runway, and fundraising timelines, cash timing is often more important than booked revenue.
Why Doesn't My Sales Pipeline Equal Cash?
Pipeline measures opportunities. Cash measures money received.
Several events occur between an opportunity appearing in HubSpot and cash reaching your account.
Typical sequence:
- deal enters pipeline
- deal moves to Commit
- contract signed
- contract starts
- invoice issued
- payment terms begin
- customer pays
- cash reaches bank
Each step introduces timing delays. This is why large pipelines do not automatically improve cash flow. For why revenue and bank balance diverge on closed deals, see ARR vs cash for founders.
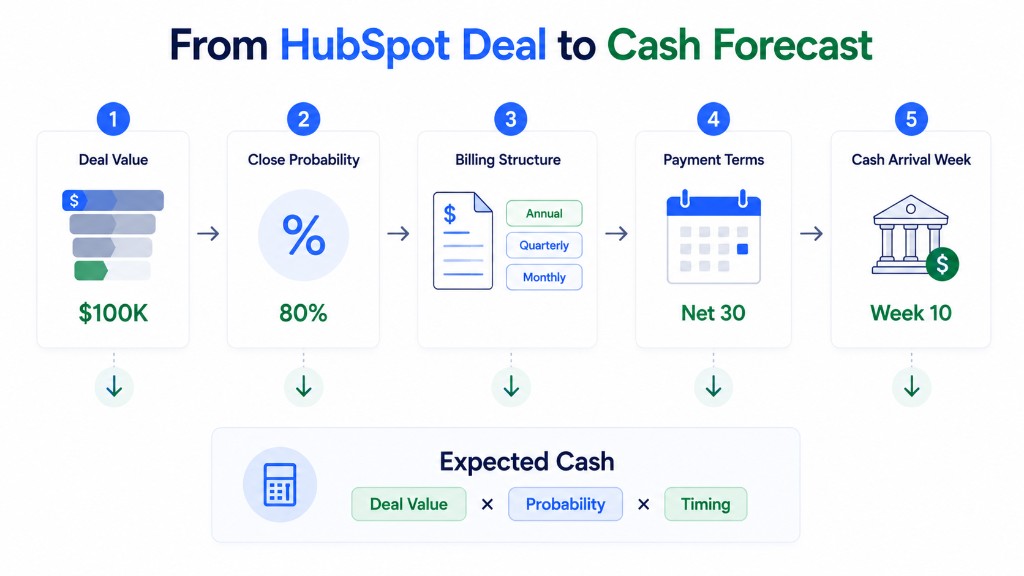
How Do You Convert Pipeline to Cash Forecast?
A pipeline cash forecast applies probability and timing assumptions to every deal before estimating expected cash receipts.
The process involves five variables:
| Variable | Why It Matters |
|---|---|
| Close probability | Not every deal closes |
| Close date | Determines contract timing |
| Contract start date | Determines billing start |
| Billing structure | Determines invoice amount |
| Payment timing | Determines actual cash arrival |
Many founders only model the first variable. The other four often matter more when you convert HubSpot deals into expected cash receipts.
What Data From HubSpot Should Be Used in a Cash Forecast?
A useful HubSpot pipeline cash forecast starts with deal value, stage, close probability, expected close date, contract start date, and billing structure.
Deal Value and Stage
Example: $100,000 deal in Commit stage.
Close Probability
Every company should calibrate probabilities using historical conversion rates.
| Stage | Probability |
|---|---|
| Commit | 80% |
| Best Case | 50% |
| Pipeline | 20% |
Expected Close Date and Contract Start
Example close: August 15. Contract start: September 1. The start date often matters more than the close date for CRM to cash forecast timing.
Billing Structure
Examples:
- annual prepaid
- quarterly prepaid
- monthly subscription
- Net 30 invoice
Billing structure determines when cash hits the bank, not just what HubSpot shows as won revenue.
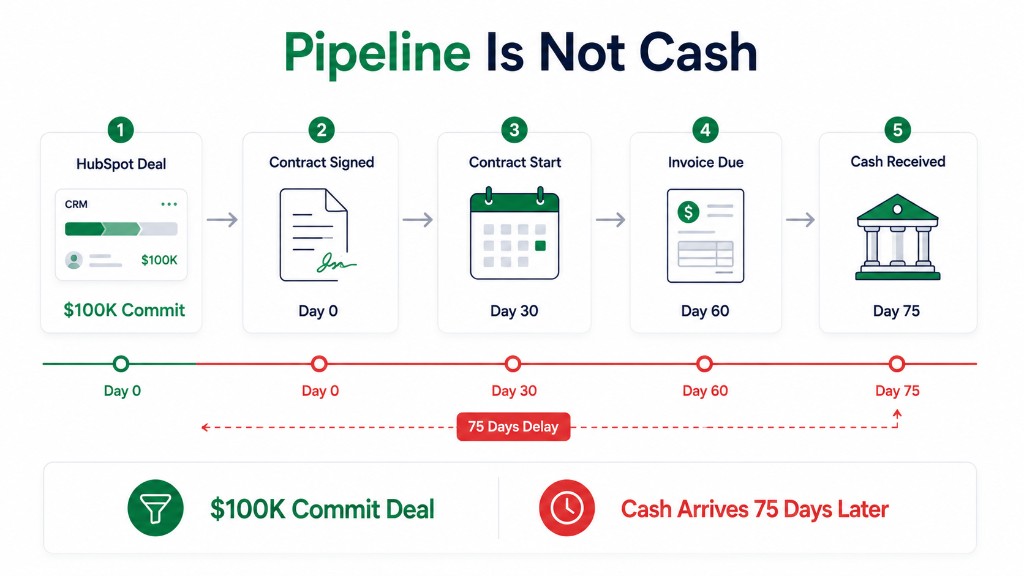
Why Can a $100,000 Commit Deal Produce Zero Cash for 75 Days?
This is one of the most common pipeline vs cash forecast mistakes founders make.
Deal Details
| Field | Value |
|---|---|
| Deal value | $100,000 |
| Stage | Commit |
| Probability | 80% |
| Expected close | August 1 |
| Contract start | September 1 |
| Billing terms | Annual prepaid |
| Payment terms | Net 30 |
| Customer payment behavior | Pays 15 days late |
At first glance, a $100,000 Commit deal looks like imminent cash. It is not.
Timeline
August 1 (deal closes):
Cash received: $0
September 1 (contract begins, invoice created):
Cash received: $0
October 1 (Net 30 due date):
Cash received: $0
October 15 (customer actually pays):
Cash received: $100,000
Result
Time from close to cash: 75 days.
The deal existed in the CRM. The revenue forecast looked strong. The cash forecast showed nothing for over two months. This is why pipeline forecasting and cash forecasting must be connected.
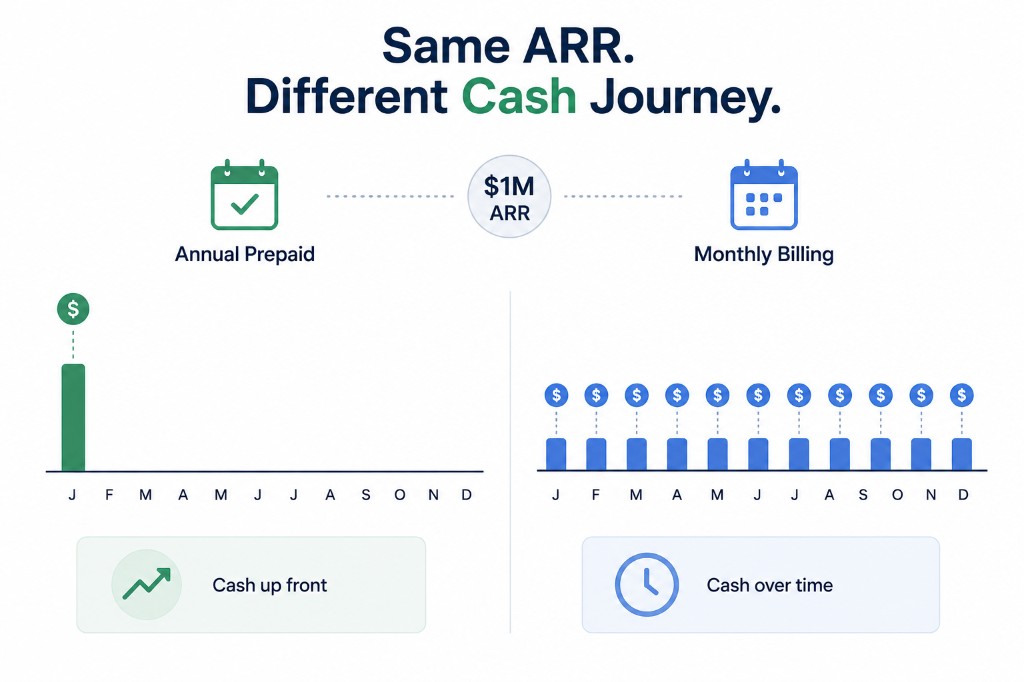
How Does Billing Structure Affect Cash Flow Forecasting?
Billing structure determines when revenue becomes cash.
Compare three identical $120,000 contracts.
Scenario 1: Annual Prepaid
Customer pays $120,000 upfront.
| Month | Cash Received |
|---|---|
| Month 1 | $120,000 |
| Month 2 | $0 |
| Month 3 | $0 |
Scenario 2: Quarterly Billing
Customer pays $30,000 every quarter.
| Month | Cash Received |
|---|---|
| Month 1 | $30,000 |
| Month 2 | $0 |
| Month 3 | $0 |
Scenario 3: Monthly Billing
Customer pays $10,000 monthly.
| Month | Cash Received |
|---|---|
| Month 1 | $10,000 |
| Month 2 | $10,000 |
| Month 3 | $10,000 |
Same contract. Completely different cash outcomes. This is billing terms cash timing in practice.
How Should You Weight Pipeline Deals in a Cash Forecast?
Weighted pipeline equals deal value multiplied by close probability.
Formula: Weighted Value = Deal Value × Probability
| Deal | Value | Probability | Weighted Value |
|---|---|---|---|
| Deal A | $100,000 | 80% | $80,000 |
| Deal B | $60,000 | 50% | $30,000 |
| Deal C | $40,000 | 25% | $10,000 |
Expected pipeline value: $120,000
However, weighted pipeline cash is still not cash. You must also model timing.
What Does a Pipeline Cash Flow Forecast Look Like?
Pipeline Snapshot
| Deal | Stage | Value |
|---|---|---|
| Acme Corp | Commit | $100,000 |
| BrightOps | Commit | $60,000 |
| Northwind | Best Case | $80,000 |
| Vertex AI | Best Case | $40,000 |
Weighted Pipeline
| Deal | Weighted Cash Potential |
|---|---|
| Acme Corp | $80,000 |
| BrightOps | $48,000 |
| Northwind | $40,000 |
| Vertex AI | $20,000 |
Expected value: $188,000
Cash Arrival Forecast
Now apply collection timing assumptions.
| Week | Expected Cash |
|---|---|
| Week 1 | $0 |
| Week 2 | $0 |
| Week 3 | $15,000 |
| Week 4 | $25,000 |
| Week 5 | $0 |
| Week 6 | $40,000 |
| Week 7 | $20,000 |
| Week 8 | $0 |
| Week 9 | $50,000 |
| Week 10 | $38,000 |
This view is significantly more useful for runway planning than a simple revenue forecast alone.
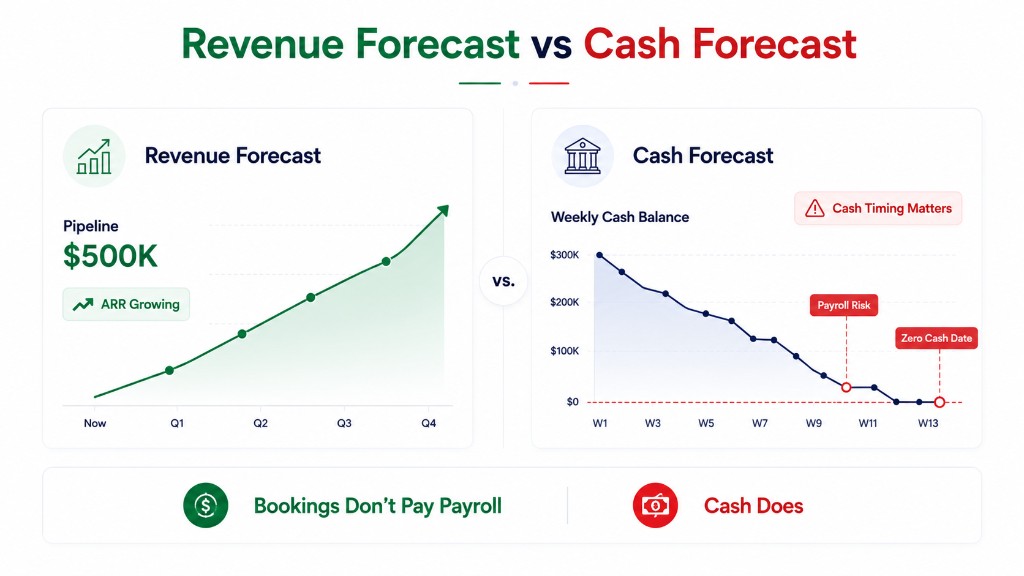
Why Is HubSpot Revenue Forecasting Different From Cash Forecasting?
Revenue forecasting predicts bookings. Cash forecasting predicts bank balance movement.
Revenue forecast asks what will close. Cash forecast asks when money arrives.
Founders often confuse the two. This creates problems such as missing payroll, unexpected fundraising pressure, vendor payment issues, and incorrect runway calculations.
For a deeper explanation of revenue versus bank balance, see ARR vs cash for founders. For weekly timing risk, see zero cash date for founders.
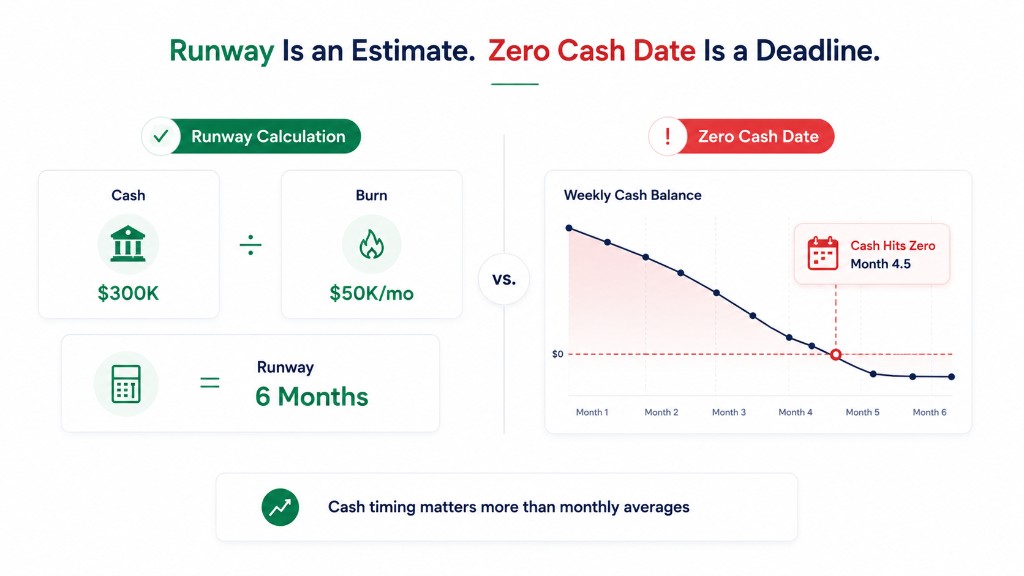
How Does Pipeline Forecasting Affect Runway?
Runway is determined by cash. Not pipeline. Not bookings. Not ARR.
Runway = Cash ÷ Net Burn
A company may have $500,000 of pipeline and still run out of cash. Pipeline does not pay salaries. Cash does.
This is why founders should always connect CRM forecasts with cash forecasts. Model yours with the free runway calculator and read runway vs burn rate for the full vocabulary.
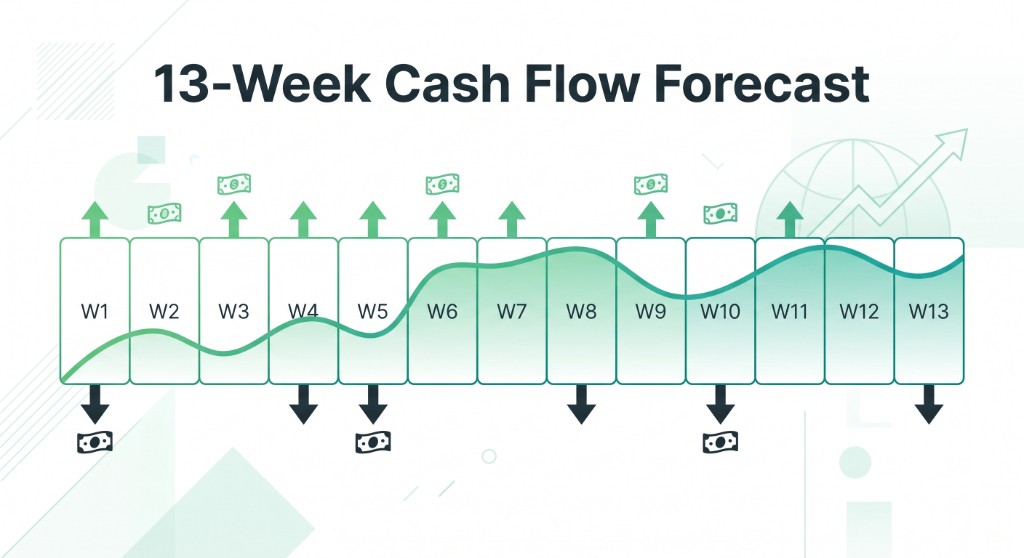
Why Do Startups Use a 13-Week Cash Forecast?
The 13-week cash flow forecast is the standard operating model used by many finance teams.
Benefits:
- captures collection timing
- captures payroll timing
- reveals cash gaps early
- supports hiring decisions
- improves fundraising planning
A 13-week forecast creates the bridge between sales activity and actual cash. See our guide on what is a 13-week cash flow forecast.
How Can Founders Connect HubSpot to Cash Forecasting?
As a company grows, manually updating spreadsheets becomes difficult. Sales data changes daily. Close dates move. Deal stages change. Payment behavior varies.
Most founders discover this problem only after cash becomes tight.
Platforms like Zensus help teams connect HubSpot pipeline and subscription data with cash forecasting assumptions: close probability, contract timing, billing schedules, collection timing, and runway projections.
At Zensus, founders connect bank data via Plaid, accounting via QuickBooks, and CRM revenue via HubSpot. See how it works for the connect-to-forecast flow.
Zensus projects when annual and quarterly contracts hit the bank, not flat monthly spreads. Founders can drill from monthly to weekly to daily cash flow, run scenarios in plain English (for example, what if our largest Commit deal slips 30 days?), and get Slack alerts when a 30-day projection crosses a cash floor they set.
This creates a more realistic view of future cash than pipeline reports alone. Plans are on the pricing page.
What Is the Best Framework for Forecasting Pipeline Cash?
A practical founder framework:
- forecast closes
- forecast contract starts
- forecast invoices
- forecast collections
- forecast bank deposits
Think about cash movement, not just deal movement. The closer your forecast gets to actual bank activity, the more useful it becomes. If payroll is the constraint, layer in will I make payroll and the payroll calendar calculator.
Final Thoughts
A sales pipeline is one of the strongest leading indicators of future growth. But growth forecasts and cash forecasts are not the same thing.
A $100,000 Commit deal can still generate zero cash for 75 days. Billing schedules, payment terms, contract timing, and customer behavior all influence when money actually reaches the bank.
The most effective founders forecast both. They track what is likely to close. They also track when cash is likely to arrive.
That second forecast is often the difference between confidently extending runway and discovering a cash problem too late.
Whether you use spreadsheets, a 13-week forecast, or a dedicated platform like Zensus, connecting HubSpot pipeline data to actual cash timing creates a much clearer picture of the future.